What is the Smith Chart: understanding the basics
Understand what the various RF mixer specifications are and what they mean so you can specify the mixer you need.
Home » Radio & RF technology » this page
Smith Charts Includes:
Smith chart basics
Smith charts have been one of the key tools used by any RF engineer when looking at complex impedance, impedance matching and the like.
These charts provide a graphical aid that gives a visual representation of complex impedance values.

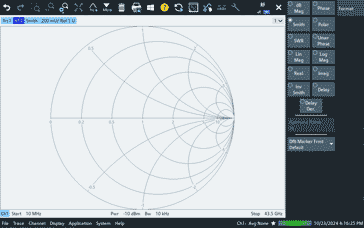
The original Smith charts were paper based, but nowadays they are generallya form of display used in computerised software. They are also one of the key display formats associated with vector network analyzers.
How Smith charts came about
Like many good ideas, inventions and developments, the basic concept of the Smith chart was independently proposed by several people.
What we now call a Smith chart was proposed by Tōsaku Mizuhashi from Japan in 1937, by Amiel R. Volpert from Russia, and finally by Phillip H. Smith in 1939.
Starting with a rectangular diagram, Smith had developed a special polar coordinate chart by 1936. Then with the collaboration of his colleagues Enoch B. Ferrell and James W. McRae, the concept was reworked into the final form in early 1937, which was eventually published in January 1939.
Smith had originally been called the chart a "transmission line chart", but early adopters at MIT's Radiation Laboratory started to refer to it simply as "Smith chart" in the 1940s and the name stuck.
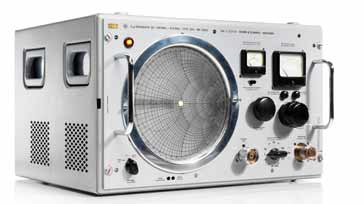
It took a while for the Smith chart to be incorporated into test equipment so that a Smith chart was actually seen on a test instrument screen. The first test instrument was launched in 1950 by Rohde & Schwarz and was called the Z-g Diagraph.

Courtesy Rohde & Schwarz
Since then, the Smith chart has become a standard option on test instruments such as vector network analyzers.
Understanding Impedance
Before looking further into Smith charts and how they can be used, it is worth taking a quick look at impedance and its affects at radio frequencies.
Impedance, in the context of RF circuits, is a complex quantity that encompasses both resistance, normally designated as R and reactance, normally designated by X.
From basic electronic and physics we understand that resistance is the opposition to the flow of direct current. Also, while reactance is the opposition to the flow of alternating current. The reactance can be either inductive (XL) or capacitive (XC).M
Although the reactive elements of any impedance act to resist the flow of electricity, they are 90° out of phase with the resistance and do not dissipate any power. Also the inductive and capacitive reactances are 180° out of phase with erach other.
As a result, they are often referred to as imaginary elements when viewed on a complex plane of real an imaginary constituents.
The Smith Chart is a polar diagram plotted on a complex plane. The horizontal axis represents the real part of impedance, i.e. the resistance. The vertical axis represents the imaginary part, i.e. the reactance.
The center of the chart corresponds to a normalized impedance of 1 (pure resistance) - it is customary to noramise the impedance to that of the impedance of the system.
It is worth noting the key features of the Smith chart:
Outer Circle: The outer circle represents all possible values of reflection coefficient (Γ), a measure of how much power is reflected from a load.
Normalized Impedance: The Smith Chart is normalized, meaning all impedance values are expressed relative to a reference impedance which is most commonly 50 ohms.
Smith Chart Transformations: Various transformations can be performed on the Smith Chart to represent different electrical quantities, such as admittance, reflection coefficient, and standing wave ratio, SWR.

Common Uses of the Smith Chart
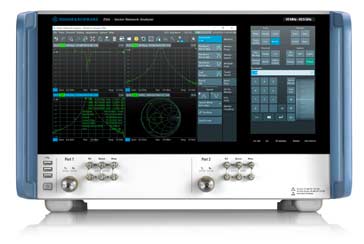
Smith charts are used in many areas associated with RF design, in paper graphical formats, but far more usually these days in terms of the visual outputs from test equipment like vector network analyzers, etc.
Impedance Matching: The Smith Chart is extensively used to design matching networks that transform the impedance of a load to match the characteristic impedance of a transmission line. This is crucial for minimizing power reflections and maximizing power transfer.
Transmission Line Analysis: The Smith Chart helps visualize the behavior of transmission lines, including standing wave patterns, voltage and current distributions, and input impedance.
Antenna Design: In antenna design, the Smith Chart is used to analyze the input impedance of antennas and to design matching networks for optimal performance.
Network Analysis: The Smith Chart can be used to analyze the behavior of various electrical networks, such as filters and amplifiers.

Courtesy Rohde & Schwarz
Key Concepts and Transformations
When using a Smith chart, or interpreting one on a screen, there are several ways in which the data can be used to give useful results.
Reflection Coefficient: The reflection coefficient (Γ) is a complex quantity that represents the ratio of the reflected voltage to the incident voltage. It can be plotted on the outer circle of the Smith Chart.
Standing Wave Ratio (SWR): The SWR is a measure of the mismatch between a load and a transmission line. It can be calculated from the reflection coefficient.
Admittance: The admittance (Y) is the reciprocal of impedance. It can be plotted on the Smith Chart by inverting the impedance values.
Smith Chart Transformations: Various transformations can be performed on the Smith Chart to represent different electrical quantities. For example, to convert from impedance to admittance, you simply rotate 180° around the center of the chart.
The Smith Chart is a powerful tool for visualizing and analyzing impedance relationships in RF circuits. Its ability to handle complex numbers and perform various transformations makes it indispensable for engineers working in radio frequency design. By mastering the Smith Chart, you can gain a deeper understanding of impedance matching, transmission line theory, and antenna design.
 Written by Ian Poole .
Experienced electronics engineer and author.
More Essential Radio Topics:
Radio Signals
Modulation types & techniques
Amplitude modulation
Frequency modulation
OFDM
RF mixing
Phase locked loops
Frequency synthesizers
Passive intermodulation
RF attenuators
RF filters
RF circulator
Radio receiver types
Superhet radio
Receiver selectivity
Receiver sensitivity
Receiver strong signal handling
Receiver dynamic range
Return to Radio topics menu . . .


